World’s urban waste mountain remains a growing problem

The amount of rubbish generated by city dwellers is set to rise steeply in the next two decades, with much of the increase coming in fast-growing cities in developing countries, according to a World Bank report published on Wednesday.

The amount of municipal solid waste is growing fastest in China – which overtook the US as the world’s largest waste generator in 2004 – other parts of east Asia, and parts of eastern Europe and the Middle East, the report says. Growth rates for rubbish in these areas are similar to their rates for urbanisation and increases in GDP.

The report estimates the amount of municipal solid waste will rise from the current 1.3bn tonnes a year to 2.2bn by 2025. The annual cost of solid waste management is projected to rise from $205bn to $375bn, with cost increasing most sharply in poorer countries. The report’s authors point to a looming crisis in waste treatment as living standards rise and urban populations grow.

“Improving solid waste management, especially in the rapidly growing cities of low-income countries, is becoming a more and more urgent issue,” said Rachel Kyte, vice-president of sustainable development at the World Bank. “The findings of this report are sobering, but they also offer hope that once the extent of this issue is recognised, local and national leaders, as well as the international community, will mobilise to put in place programmes to reduce, reuse, recycle, or recover as much waste as possible before burning it (and recovering the energy) or otherwise disposing of it. Measuring the extent of the problem is a critical first step to resolving it.”

The report notes that municipal solid waste management is the most important service a city provides. In poorer countries, rubbish collection and processing is often the largest single budget item for cities, and one of the largest employers.

You might also like “Beijing buys a waste management company to solve its pollution problems—but it won’t work“… here

Global Food – 2 billion tonnes of all food produced ends up as waste

As much as 2 billion tonnes of all food produced ends up as waste Institution of Mechanical Engineers calls on urgent action to prevent 50% of all food produced in the world ending up as waste 10 January 2013
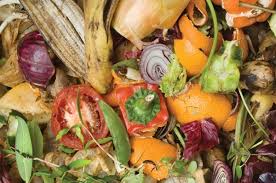
A report by the Institution of Mechanical Engineers has found that as much as 50% of all food produced around the world never reaches a human stomach due to issues as varied as inadequate infrastructure and storage facilities through to overly strict sell-by dates, buy-one-get-one free offers and consumers demanding cosmetically perfect food.
With UN predictions that there could be about an extra three billion people to feed by the end of the century and an increasing pressure on the resources needed to produce food, including land, water and energy, the Institution is calling for urgent action to tackle this waste.

The report ‘Global Food; Waste Not,Want Not’ found that:

• between 30% and 50% or 1.2-2 billion tonnes of food produced around the world each year never reaches a human stomach;
• as much as 30% of UK vegetable crops are not harvested due to them failing to meet exacting standards based on their physical appearance, while up to half of the food that’s bought in Europe and the USA is thrown away by the consumer;
• about 550 billion m3 of water is wasted globally in growing crops that never reach the consumer;
• it takes 20-50 times the amount of water to produce 1 kilogram of meat than 1 kilogram of vegetables;
• the demand for water in food production could reach 10–13 trillion m3 a year by 2050. This is 2.5 to 3.5 times greater than the total human use of fresh water today and could lead to more dangerous water shortages around the world;
• there is the potential to provide 60-100% more food by eliminating losses and waste while at the same time freeing up land, energy and water resources.

Dr Tim Fox, Head of Energy and Environment at the Institution of Mechanical Engineers said: “The amount of food wasted and lost around the world is staggering. This is food that could be used to feed the world’s growing population – as well as those in hunger today. It is also an unnecessary waste of the land, water and energy resources that were used in the production, processing and distribution of this food.

“The reasons for this situation range from poor engineering and agricultural practices, inadequate transport and storage infrastructure through to supermarkets demanding cosmetically perfect foodstuffs and encouraging consumers to overbuy through buy-one-get-one free offers.  “As water, land and energy resources come under increasing pressure from competing human demands, engineers have a crucial role to play in preventing food loss and waste by developing more efficient ways of growing, transporting and storing foods. “But in order for this to happen Governments, development agencies and organisation like the UN must work together to help change people’s mindsets on waste and discourage wasteful practices by farmers, food producers, supermarkets and consumers.”

By 2075 the UN predicts that the world’s population is set to reach around 9.5 billion, which could mean an extra three billion mouths to feed. A key issue to dealing with this population growth is how to produce more food in a world with resources under competing pressures – particularly given the added stresses caused by global warming and the increasing popularity of eating meat – which requires around 10 times the land resources of food like rice or potatoes.

The world produces about four billion metric tonnes of food per year, but wastes up to half of this food through poor practices and inadequate infrastructure. By improving processes and infrastructure as well as changing consumer mindsets, we would have the ability to provide 60-100% more food to feed the world’s growing population.
The ‘Global Food; Waste Not,Want Not’ report recommends that:

1. The UN Food and Agriculture Organisation (FAO) works with the international engineering community to ensure governments of developed nations put in place programmes that transfer engineering knowledge, design know-how, and suitable technology to newly developing countries. This will help improve produce handling in the harvest, and immediate post-harvest stages of food production.
2. Governments of rapidly developing countries incorporate waste minimisation thinking into the transport infrastructure and storage facilities currently being planned, engineered and built.
3. Governments in developed nations devise and implement policy that changes consumer expectations. These should discourage retailers from wasteful practices that lead to the rejection of food on the basis of cosmetic characteristics, and losses in the home due to excessive purchasing by consumers.

You might also like “The Under-Recognised Public Health Problem of Food Waste” here

Webinar State of Waste: relationship between landfill pricing and recycling

Australia generates 46.8 MT of waste. Despite steady increases in the rate of recovery (av. 52%), the waste generated between 2002/03 and 2008/09 grew by 40%, while population increased by only 10% (SoE Report NSW, 2013). There are more of us but we are consuming proportionally more each year per person.

Waste generation has been growing at a historic average of 4-7% per year and still is. That means the amount of waste the industry has to process is doubling every ten to eighteen years.

However, the good news is that we are recycling a lot more and recycling jobs are largely recession proof, green collar jobs. Recycling is probably the only growth area in the manufacturing sector in Australia. We create nine jobs in recycling for every job in landfill.

 It is not rocket science and it can be done. It needs leadership from government and investment by business when the price signals allow it.

WEBINAR: State of Waste

webinarMikeRitchie Vis6DATE: Thursday April 17th 2014
TIME: 1-1.45 PM
SPEAKER: Mike Ritchie
DURATION: 45 minutes, 30 minutes presentation followed by 15 minutes Q&A
 

Key take outs

  • The presentation will explore the relationship between landfill pricing and recycling.
  • It will document the key initiatives required over the next decade to drive improved recycling in the MSW, C+I and C+D sectors.

Presenter

Mike Ritchie Webinar

Mike Ritchie Webinar

Mike Ritchie has over 20 years’ experience in environmental policy and business development. Mike has over 20 years’ experience in environmental policy and business development. Prior to launching MRA, he was National General Manager, Marketing, and Business Development with SITA Environmental Solutions, and has worked in local government as advisor to the Lord Mayor of Brisbane and Director of Liverpool City Council.

He is past National Vice President and NSW President of WMAA, as well as current Chair of the Carbon Division and AWT Working Group. He is also past director of Environment Business Australia and is a Sessional Commissioner of the Land & Environment Court NSW.

Registration

register button webinarTarget Audience:  open to all levels of sustainability professionals across all sectors interested in waste management
LIMITED TO ONLY 50 PARTICIPANTS
Register online

 The Association for Sustainability in Business

SusBizAssoc2FEEDBACK: Email questions to [email protected]
Join  the Association for Sustainability in Business,
Visit our website to find out about our member benefits
URL: www.sustainabilitybusiness.com.au

Independent Distributed Energy and Transport Systems

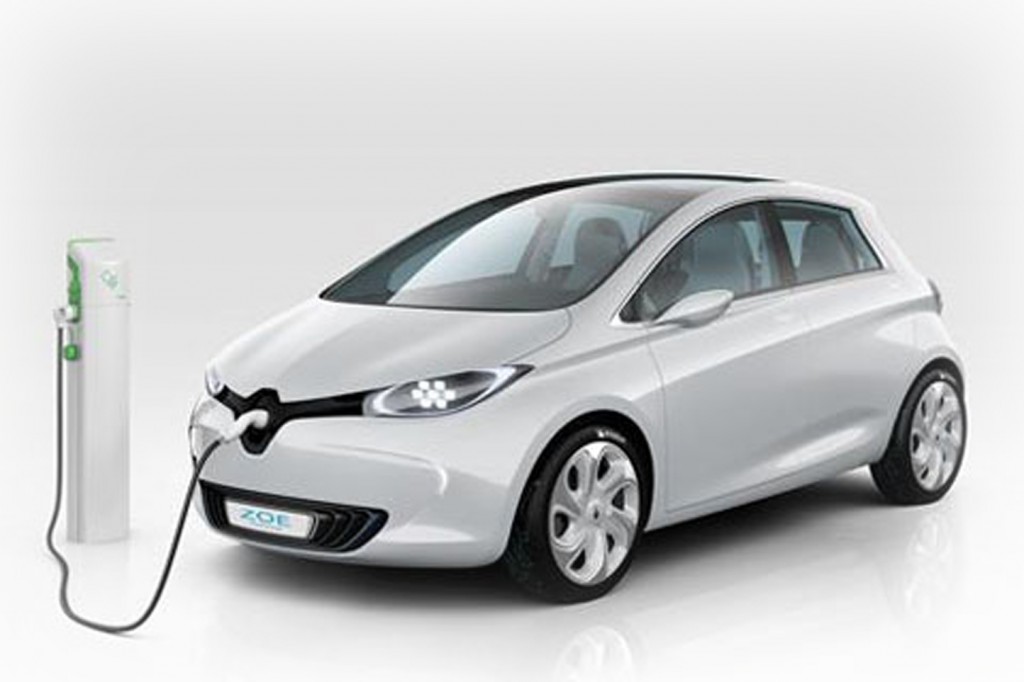
Electric Vehicles provide clean and efficient transport systems – bus, car, bike, ferry EV also can be used as mobile energy storage/backup energy storage – EV can be charged during day from solar to provide additional backup energy for peak day/night if required with smart systems ensuring energy left for travel the next day and top up power from off peak electricity.

Integrated with solar they can provide zero emissions transport – plug in charging stations can be located almost anywhere with stations having their own battery storage to fast charge vehicles for increased range. Stations can be located at supermarkets, shopping centres, work sites as well as commercial charging stations. Customers with solar can sell power to other customers rather than to big distributors so distributed energy systems rather than centralised improves energy security.

This needs to be managed by progressive distribution networks The E-revolution is soon to become a reality in Australia.  Electric vehicles and devices will explode within the space of ten years offering those who are ready, equipped and capable of understanding the bigger picture, employment and development opportunities that will parallel the early industrial revolution.  With the introduction of eVehicle, eBike, eScooter and eBus, solar energy capture and energy distribution infrastructure will also offer a major investment portfolio prospect for organisations seeking returns for their members.

Colin Gillam  spoke at the  Making Cities Liveable Conference in conjunction with the Sustainability Conference “SustainableTransformation” in Melbourne in 2013.

Electric Cars May Be Safer than Conventional Vehiclesmore

Sustainable Renewable Energy Sources in US continue to grow

Sustainable Renewable Energy

According to the latest issue of the U.S. Energy Information Administration’s (EIA) “Electric Power Monthly,” with preliminary data through to June 30, 2013, renewable energy sources (i.e., biomass, geothermal, hydropower, solar, wind) provided 14.20 percent of the nation’s net electric power generation during the first half of the year. For the same period in 2012, renewables accounted for 13.57 percent of net electrical generation.

Moreover, non-hydro renewables have more than tripled their output during the past decade. They now account for almost the same share of electrical generation (6.71 percent) as does conventional hydropower (7.49 percent). Ten years ago (i.e., calendar year 2003), non-hydro renewables provided only 2.05 percent of net U.S. electrical generation.

Comparing the first six months of 2013 to the same period in 2012, solar thermal & PV combined have grown 94.4 percent (these additions understate actual solar capacity gains. Unlike other energy sources, significant levels of solar capacity exist in smaller, non-utility-scale applications – e.g., rooftop solar photovoltaics). Wind increased 20.1 percent and geothermal grew by 1.0 percent, while biomass declined by 0.5 percent while hydropower dropped by 2.6 percent. Among the non-hydro renewabes, wind is in the lead, accounting for 4.67 percent of net electrical generation, followed by biomass (1.42 percent), geothermal (0.43 percent), and solar (0.19 percent).